
Other information: Corporate & Investment Banking
Highlights
- Strong performance in lending activity continues. Dynamism of customer funds in the quarter
- Double-digit gross income growth
- Improved efficiency ratio
- Increase in provisions for impairment on financial assets
Business activity (1)
(VARIATION AT CONSTANT EXCHANGE RATES COMPARED TO 31-12-21)

(1) Excluding repos.
Gross income / AVERAGE TOTAL ASSETS
(Percentage. Constant exchange rates)

Operating income
(Millions of euros at constant exchange rates)
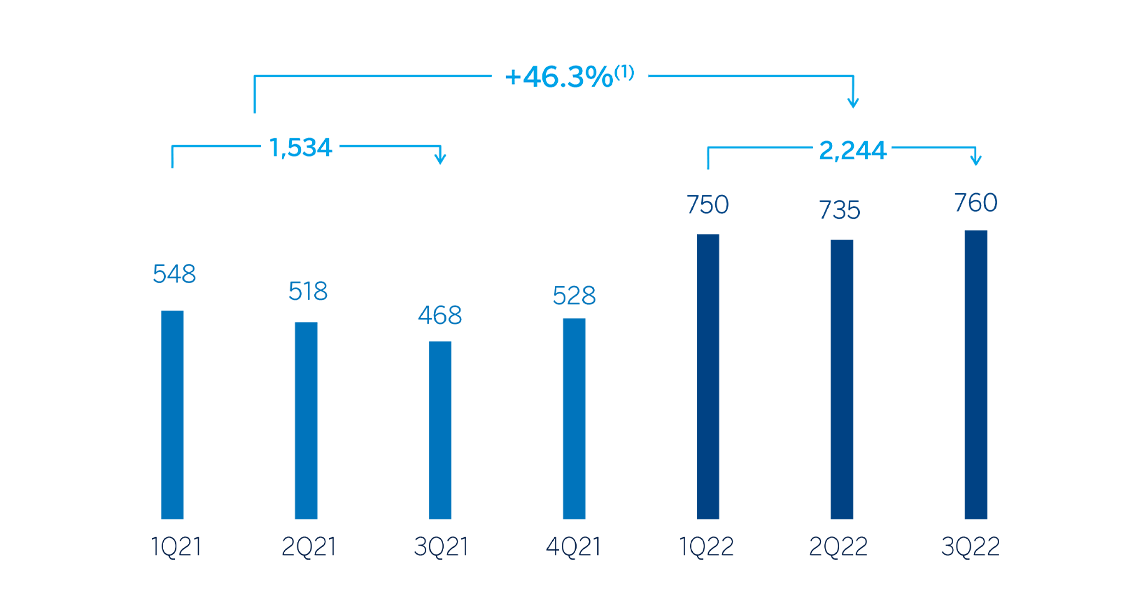
(1) At current exchange rates: +37.2%.
Net attributable profit (LOSS)
(Millions of euros at constant exchange rates)
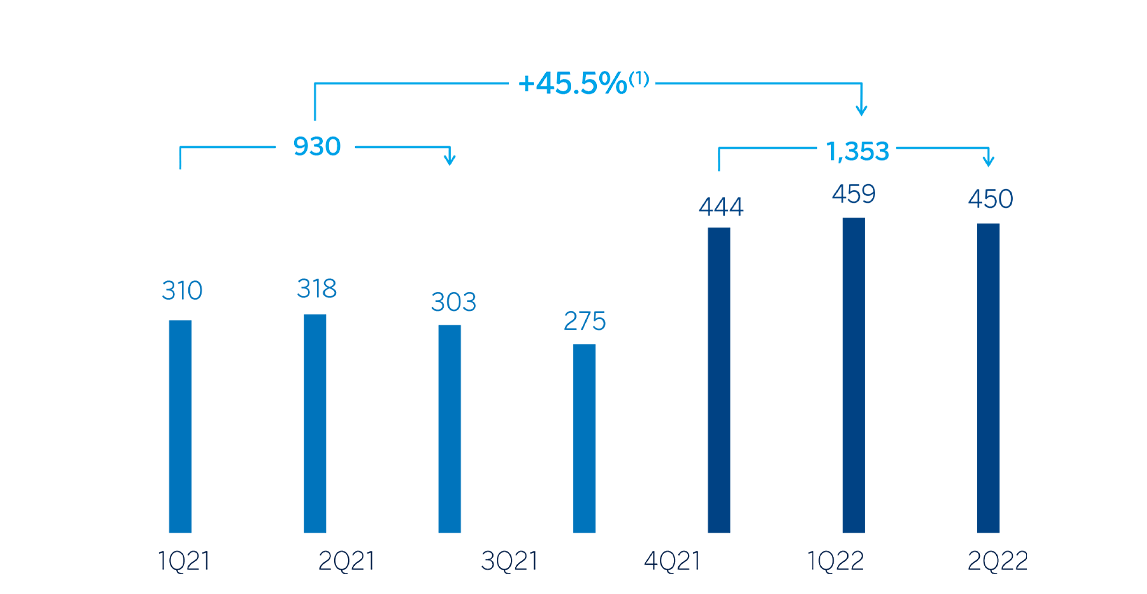
(1) At current exchange rates: +42.7%.
Financial statements and relevant business indicators (Millions of euros and percentage)
| Income statement | Jan.-Sep. 22(1) | ∆% | ∆% (2) | Jan.-Sep. 21 (3) |
|---|---|---|---|---|
| Net interest income | 1,471 | 27.3 | 32.7 | 1,156 |
| Net fees and commissions | 679 | 16.5 | 20.5 | 583 |
| Net trading income | 947 | 49.0 | 55.5 | 636 |
| Other operating income and expenses | (30) | 5.5 | 1.6 | (28) |
| Gross income | 3,067 | 30.7 | 36.2 | 2,346 |
| Operating expenses | (823) | 15.8 | 14.7 | (711) |
| Personnel expenses | (376) | 16.0 | 14.3 | (324) |
| Other administrative expenses | (368) | 20.4 | 20.0 | (305) |
| Depreciation | (79) | (2.3) | (3.7) | (81) |
| Operating income | 2,244 | 37.2 | 46.3 | 1.635 |
| Impairment on financial assets not measured at fair value through profit or loss | (65) | n.s. | n.s. | (13) |
| Provisions or reversal of provisions and other results | 9 | n.s. | n.s. | - |
| Profit (loss) before tax | 2,188 | 34.9 | 43.6 | 1,622 |
| Income tax | (621) | 36.8 | 44.1 | (454) |
| Profit (loss) for the period | 1,567 | 34.1 | 43.4 | 1,168 |
| Non-controlling interests | (214) | (2.9) | 31.4 | (220) |
| Net attributable profit (loss) | 1,353 | 42.7 | 45.5 | 948 |
- (1) For the translation of the income statement in those countries where hyperinflation accounting is applied, the punctual exchange rate as of September 30, 2022 is used.
- (2) At constant exchange rates.
- (2) Restated balances. For more information, please refer to the “Business Areas” section.
| Balance sheets | 30-09-22 | ∆% | ∆% (1) | 31-12-21 |
|---|---|---|---|---|
| Cash, cash balances at central banks and other demand deposits | 7,134 | 39.2 | 23.7 | 5,125 |
| Financial assets designated at fair value | 124,528 | (5.5) | (7.7) | 131,711 |
| Of which: Loans and advances | 38,851 | (29.7) | (30.5) | 55,232 |
| Financial assets at amortized cost | 91,927 | 27.0 | 22.9 | 72,363 |
| Of which: Loans and advances to customers | 78,837 | 27.1 | 22.7 | 62,042 |
| Inter-area positions | - | - | - | - |
| Tangible assets | 52 | 21.5 | 15.0 | 43 |
| Other assets | 1,916 | n.s. | n.s. | 110 |
| Total assets/liabilities and equity | 225,557 | 7.7 | 4.7 | 209,352 |
| Financial liabilities held for trading and designated at fair value through profit or loss | 104,536 | 9.7 | 7.1 | 95,283 |
| Deposits from central banks and credit institutions | 22,493 | 74.6 | 70.9 | 12,884 |
| Deposits from customers | 45,078 | 17.5 | 12.0 | 38,360 |
| Debt certificates | 5,358 | (6.7) | (13.9) | 5,746 |
| Inter-area positions | 31,821 | (28.0) | (29.2) | 44,196 |
| Other liabilities | 4,588 | 58.2 | 59.5 | 2,901 |
| Regulatory capital allocated | 11,682 | 17.0 | 11.8 | 9,983 |
| Relevant business indicators | 30-09-22 | ∆% | ∆% (1) | 31-12-21 |
|---|---|---|---|---|
| Performing loans and advances to customers under management (2) | 78,936 | 28.2 | 23.6 | 61,588 |
| Non-performing loans | 780 | (45.0) | (40.3) | 1,417 |
| Customer deposits under management (2) | 44,417 | 18.6 | 12.9 | 37,445 |
| Off-balance sheet funds (3) | 1,792 | 36.4 | 42.6 | 1,314 |
| Efficiency ratio (%) | 26.8 | 30.9 |
- (1) At constant exchange rates.
- (2) Excluding repos.
- (3) Includes mutual funds, customer portfolios and other off-balance sheet funds.
Unless expressly stated otherwise, all the comments below on rates of change, for both activity and results, will be given at constant exchange rates. For the conversion of these figures in those countries in which accounting for hyperinflation is applied, the punctual exchange rate as of September 30, 2022 is used. These rates, together with changes at current exchange rates, can be found in the attached tables of financial statements and relevant business indicators.
Activity
The most relevant aspects related to the area's activity in the first nine months of 2022 were:
- Lending activity (performing loans under management) continued to grow at double digit rates and accumulates a growth of 23.6% in the first nine months of 2022, with a positive performance in all geographical areas, except for Peru. By products, both Investment Banking & Finance and Global Transactional Banking have shown very positive dynamics, although the latter showed a certain slowdown in the quarter.
- Customer funds increased during the first nine months of the year (+13.8%). Thanks to the active management of the area, deposits from the Group’s wholesale customers continue to be a relevant lever for the BBVA’s liquidity management. By geographical areas, the positive evolution in South America and Rest of Business stands out.
The most relevant developments in the area's activity in the third quarter of 2022 were:
- Lending activity (performing loans under management) increased in the quarter (+6.8%) especially due to the performance of New York, Spain and the branches in Europe, with outstanding operations with corporate clients and a good evolution of factoring.
- Customer funds increased by 9.7% between July and September, with growth in time deposits (+30.4%) offsetting the flat behavior of demand deposits (-0.1%).
Results
CIB generated a net attributable profit of €1,353m in the first nine months of 2022. These results, which do not include the application of hyperinflation accounting, represent an increase of 45.5% on a year-on-year basis, due to the growth in recurring income and NTI, which comfortably offset the higher expenses and provisions for impairment on financial assets. It should also be noted that all business lines of the CIB area recorded growth compared to the first nine months of 2021, both in revenues and net attributable profit.
The contribution by business areas, excluding the Corporate Center, to CIB's accumulated net attributable profit at the end of September 2022 was as follows: 28% Spain, 27% Mexico, 21% Turkey, 15% South America and 9% Rest of Business.
The most relevant aspects of the year-on-year evolution in the income statement of this aggregate are summarized below:
- At the end of the first nine months of the year, net interest income was 32.7% above the same period last year, with growth in the main geographical areas thanks to the aforementioned good performance of lending activity and the performance of the Global Markets and Global Transactional Banking units.
- Net fees and commissions recorded an increase of +20.5%, mainly due to the performance of transactional banking.
- NTI showed a good evolution (+55.5%), mainly due to the performance of the Global Markets unit, driven by the income from business activity and intraday trading in foreign exchange positions.
- Operating expenses increased by 14.7% in the first nine months of 2022, in a year-on-year comparison affected by the cost containment plans implemented by CIB in 2021, in addition to the high inflationary environment, although the area continues to focus its efforts on discretionary expenses. Despite the aforementioned, the efficiency ratio stood at 26.8%, which is a significant improvement over the same period last year (-504 basis points).
- Increase in provisions for impairment on financial assets mainly due to customers sensitive to changes in the exchange rate.
- Finally, the provision and other results line recorded a positive result of €9m due to the release of provisions for risks and contingent commitments made in the New York branch.
In the third quarter of 2022 and excluding the effect of the variation in exchange rates, the Group's wholesale businesses generated a net attributable profit of €450m (-1.8% compared to the previous quarter). This performance is mainly explained by the higher provisions for impairment of financial assets, which offset the good performance of revenues in the area, especially the double-digit growth in net interest income.